|
Author
|
Topic: Amplitude and Excursion
|
blalock
Member
|
 posted 04-09-2009 01:56 PM
  
Raymond, et al,For the EDA and Cardio channels, we notice a high correlation between baseline increase in amplitude and deception. Computer scoring algorithms theoretically miss possible diagnostic criteria such as duration and complexity. Yet one of the advantages of using excursion in measurement is that it avoids the need to specify an arbitrary metric for distance on the x-axis (Kircher & Raskin, 2002). My question is, what tools and/or measuring capabilities do we have currently at our disposal to capitalize on extracting more diagnostic criteria (at least duration and complexity, and possibly recovery time) from our recorded data? And, assuming that the answer to this question is that "we don't have much available presently," what do we need to do
to get those tools and/or measuring capabilities? ------------------
Ben blalockben@hotmail.com [This message has been edited by blalock (edited 04-09-2009).] IP: Logged |
Barry C
Member
|
posted 04-09-2009 03:13 PM
Ben,Check CPS-LAB and see what features you can extract. I don't remember off the top of my head. Measuring complexity shouldn't be too difficult. If you are looking at excursion (and I think both Limestone and CPS do that now), then complexity can be "seen" by a rise followed by a (short) period of a lack of excursion from the previous rise, followed by an increase in amplitude (excursion from the x-axis). I would think the "tough" part would be creating the algorithms to "see" what we see. It's not impossible, any more than having the computer measure the "floating RLL window" DACA now uses, which I discussed with John Kircher some time ago, and he agreed it could be done without a lot of work. IP: Logged |
Ted Todd
Member
|
posted 04-09-2009 03:14 PM
Ben,Could we use the same principles used in RLL. With GSR, I would asssume that the opposite would be true; The longer the RLL, the higher the deceptive score will likely be. Ted IP: Logged |
blalock
Member
|
posted 04-09-2009 03:18 PM
Ted,I remember running a correlation on GSR line length on two different data sets, and they both showed a very decent correlation to deception, but not as much as amplitude increase... ------------------
Ben blalockben@hotmail.com IP: Logged |
Ted Todd
Member
|
posted 04-09-2009 03:22 PM
Ben, I would suspect that the increase in amplitude would be a part of the overall RLL in the GSR ? Ted IP: Logged |
blalock
Member
|
posted 04-09-2009 03:33 PM
that is correct, but not everything is criteria, so when a measurement measures too many criteria (ie criteria that does not specifically correlate to ANS arousal, then the measurement is "watered down." It is the same problem we have when we have too many scoring criteria (i.e. ascending staircase in pneumo, and decrease in baseline and pvcs in cardio)... The trick is to find a way to measure as exclusively as possible the criteria that most correlates with deception... I hope all of that made sense...------------------
Ben blalockben@hotmail.com IP: Logged |
Barry C
Member
|
posted 04-09-2009 05:34 PM
quote:
Could we use the same principles used in RLL. With GSR, I would assume that the opposite would be true; The longer the RLL, the higher the deceptive score will likely be.
A quickly plunging EDA could have a longer line-length than a real reaction. It's not a bad idea, but amplitude increase adds more to the model, which means EDALL would result in a reduction in accuracy. John Kircher Dave Raskin looked at a lot of this stuff way back in the 80s, and what they've found still holds true today, which is why OSS, CPS and any other algorithm that uses the best features does well, very well. There are a lot of features that correlate with deception, but adding them all together doesn't necessarily make things even better - even for a computer. (With people, the more criteria, the more chance for error, which means less accuracy.) IP: Logged |
rnelson
Member
|
posted 04-09-2009 09:40 PM
Ben,I'm told that both Limestone and Lafayette measure excursion for RLL. So does Stoelting. This is good, even though it's not technically RLL. Excursion is very similar to RLL, but removes the arbitrary x-axis metric from the equation. The speed of paper or screen scrolling has nothing to do with physiology, so this value is simply noise. Silicon chips can do some fancy things that only a few idiot-savant types would want to spend time with. So, we should let them. For us carbon-creatures RLL is easy to understand, and excursion would require more calculation effort. For computers is actually a bit more involved to calculate RLL than excursion. Excursion would seem to capture Amplitude, duration and complexity in a single measurement value. One complication is that upward movement of the EDA is assumed to be indicative of sympathetic activation, while downward EDA movement is not parasympathetic but simple resorption. In the cardio, upward movement is reflective of sympathetic activation and downward movement is assumed to be indicative of parasympathetic activation. So, it might make sense to include only positive values, into an EDA or cardio excursion measurement, so that only upward (sympathetic) movement is include in the measured value. This would theoretically still capture amplitude duration and complexity. Kircher and Raskin (2002) describe excursion as the sum of absolute differences of successive (respiratory) measurements. This would mean that both upward and downward movements are included in a respiratory excursion (RLL) measurements. Ben, your results, as Barry describes, may be related to the inclusion of negative/downward (noise) values in the excursion measurement, whereas simple amplitude measurements will be devoid of resorption data. Another complication with downward tracings may be the attenuating influence of the auto-centering filters on duration and complexity data. Limestone presently has the ability to select the type of measurement applied to each channel. However, I don't think there is a feature yet to include only positive/upward values in the excursion measurement. Barry, your right that simply adding features and data doesn't always improve things mathematically. That is why regression and discriminate analysis are important. We know from Kircher and Raskin (1988) that adding the vasomotor data helps - but that really only applies to vasomotor data measured the way they measured it, and combined with the other measurements as they obtained those values. How sure are we that adding a vasomotor excursion measurement would not result in a different set of regression coefficients or different discriminate function for all other components. Its possible that some components begin to contribute in differing degrees if we were to add new and improved features to the equation. There are really two issues at play: 1) does the new feature work, and 2) what is the optimal mathematical combination of the new feature with other existing features. A number of studies provide evidence of the validity of the Kircher features. Here are a few: Kircher and Raskin (1988)
Raskin, Kircher, Honts, Horowits (1988)
Harris, Horner & McQarrie (2000)
Kircher, Krisjiansson, Gardner & Webb (2005) Then you have additional evidence of validity through the handful of algorithms that have been built on the Kircher features: Honts and Driscoll (1988)
Kircher and Raskin (1988) CPS algorithm
Honts and Devitt (1992)
Krapohl and McManus (1999)
Krapohl and MacLaren (2003) and, of course, OSS-3 With so much evidence of validity, anyone who wants to suggest that other features will perform better than the Kircher features, had better be prepared to prove it with replicatable experiments - else it will be impossible for any scientific thinker to regard such suggestions with any credibility. .02 r ------------------
"Gentlemen, you can't fight in here. This is the war room."
--(Stanley Kubrick/Peter Sellers - Dr. Strangelove, 1964)
IP: Logged |
ebvan
Member
|
posted 04-11-2009 12:55 PM
Regarding the EDA channel, what would be the difference between Excursion and Duration?I presume that Excursion would somehow combine Amplitude and Duration into a single measurement an that once this is accomplished then it is conceivable that a response of greater duration and less amplitude would out score a response of greater amplitude and less duration providing that any plunging EDA would be excluded. ------------------
Ex scientia veritas IP: Logged |
Barry C
Member
|
posted 04-11-2009 07:06 PM
Be careful not to turn "excursion" into something it's not. When we talk about it, we mean how far a data point is from the x-axis. If we think about just measuring a line, we can make the line longer if we just set our analog (or computer - but it's easier to picture this way) to scroll the chart paper twice as fast. Did the person react more? No, we just made our instrument collect more ink, which, as Ray said, has nothing to do with physiology.As to your question, if I understand you correctly, yes, you could create that problem, which isn't helpful. When we're talking about EDA, we really only need to know two points: the low point (excursion from the x-axis) and the high point. Of course, we only want positive changes (not dropping EDA tracings). IP: Logged |
rnelson
Member
|
posted 04-11-2009 11:32 PM
Barry,You left out the most important part about that increase in ink/line-length just by doubling the paper speed. Imagine calculating a ratio based on a certain degree of Y axis activity at the normal paper speed. Now imagine the same ratio calculated with the same volume of Y axis activity and the doubled paper speed. The ratios will be different due to the influence of the arbitrary change in the X-axis data/speed. Any normative parameters based on line-length will be non-resistant to changes in the x-scale. Kircher and Raskin (2002) reported excursion to be highly correlated with RLL (r > .95) - which can be considered near perfect. The main advantage is that excursion measurements and normative data will be resistant to changes in the x-scale (how fast the paper/screen moves). Excursion does not seem to be "how far the data is from the x-axis." For that to work we would have to have a known zero point, which we do not. Without a known zero, all metrics are again arbitrary. Kircher and Raskin (2002) describe excursion on page 295 of Kleiner's book:
quote:
We have since introduced the sum of absolute deviations between successive samples of the respiration tracing (respiration excursion) as our standard measure of respiration suppression.
This is just a a little ambiguous, but it makes sense. "Successive samples" refers to the computer samples of so-many measurements per second. "Deviations" generally refers to the distance of a single sample from a mean (average). In this usage that does not make sense, because it would require averaging all of the respiratory measurements during the measurement period (scoring window). It is more likely that "deviations" in this usage actually refers to the "difference" score between successive respiratory samples/measurements - which are obtained simply by taking each measurement and subtracting the value of the previous sample. If the tracing is going up the present sample will be a greater numerical value (expressed in analog to digital conversion units or a to d values) than the previous sample, and the difference will be a positive value. If the tracing is going down, the present value will be smaller than the previous a to d value, and the difference will be a negative value. "Sum of absolute (differences)" refers to calculating all the differences for all measurements during the scoring period, changing all of the sign values to positive, and then adding up all the numbers. Bada-bing-bada-boom = a measurement of excursion. Now consider the effect of very high sampling rates... Very high sampling rates will capture very small changes in tracing amplitude or height. Some will be tiny upward movements. Some will be tiny downwards movements, perhaps even in the context of an ascending data segment. It is also possible to have very tiny upward movements in a descending segment. This is because very high sampling rates can measure miniscule changes. To the extent that very tiny up or down movements are not indicative of physiological activity of any interpretable value or interest, measurement of these values could introduce noise to the excursion value because the effect of adding the absolute values of these tiny/noise values will be to lengthen the absolute excursion measurement. The solution is to refrain from being overly impressed with how-many-bazillion samples per second we can capture, and simply select a moderately high sampling rate that captures all the data of interest and remains resistant to high frequency noise. There may be some physiological indices that benefit from very high sampling, but I suspect that respiratory excursion may not be one of the them. The point of a scientific approach is to refrain from overly-psychologizing whether it is, or is not, a problem that a response of greater duration would out score a response of greater amplitude and less duration. It is possible that this effect is attenuated by the fixed and terminal scoring period. The real point is to collect and study the data, try to understand it, and then follow the science. If it;s better, then it's better. If it's not, then it's not. Polygraph has evolved to a point where we have to refrain from letting our sensibilities instruct us about whether or not something is a problem - we'll be better off in the long run if we follow the data. .02 r ------------------
"Gentlemen, you can't fight in here. This is the war room."
--(Stanley Kubrick/Peter Sellers - Dr. Strangelove, 1964)
IP: Logged |
Barry C
Member
|
posted 04-13-2009 05:55 AM
All good points. quote:
It is more likely that "deviations" in this usage actually refers to the "difference" score between successive respiratory samples/measurements - which are obtained simply by taking each measurement and subtracting the value of the previous sample. If the tracing is going up the present sample will be a greater numerical value (expressed in analog to digital conversion units or a to d values) than the previous sample, and the difference will be a positive value. If the tracing is going down, the present value will be smaller than the previous a to d value, and the difference will be a negative value.
This is the correct way of explaining my oversimplified statement of distance from the x-axis. If you picture it, the x-axis is "floating," so to speak, when I talk about distance from it. The x-axis doesn't float, which is why figuring out the "distances" is much more of a complex task - but not for the computer. quote:
The point of a scientific approach is to refrain from overly-psychologizing whether it is, or is not, a problem that a response of greater duration would out score a response of greater amplitude and less duration. It is possible that this effect is attenuated by the fixed and terminal scoring period. The real point is to collect and study the data, try to understand it, and then follow the science. If it;s better, then it's better. If it's not, then it's not. Polygraph has evolved to a point where we have to refrain from letting our sensibilities instruct us about whether or not something is a problem - we'll be better off in the long run if we follow the data.
Kircher said he looked at duration and found it doesn't work as well as amplitude. In fact, he said by itself, it decreases accuracy of the model, I think, so we have data on this. However, I didn't think of it until now, but measuring it may have been done differently, so we may still have questions. If somebody wants to look at his lens model study, you might find the answer there, but I don't think we're without data on this. IP: Logged |
ebvan
Member
|
posted 04-13-2009 10:15 AM
When we talk about excursion and RLL, if you measure it by hand, RLL is the measured distance traveled along the path taken by the marker between a known point, stimulus onset, and a second known point which is established by applying the rate of chartmovement measured by a specific period of time, both of which must remain constant for comparison. I think in this context, excursion and RLL are the same thing. Amplitude and I/E Ratio no matter what they look like (absent artifacts) are only considered by whatever effect they might have on RLL regardless of their appearance.
Wouldn't an "Excursion" measurement of EDA also measure the length of the path traveled along the pen path from one known point to another known point between Stmulus onset and a second known point which is established by applying the rate of chartmovement measured by a specific period of time? ------------------
Ex scientia veritas IP: Logged |
rnelson
Member
|
posted 04-14-2009 09:46 AM
Ebvan,RLL and excursion are essentially the same thing, but not exactly. The problem here is really a geometric and algebraic one. Time (i.e. 10 seconds of respiration data) is not measured in inches or millimeters of chart paper or computer screen. Time is measured in seconds, including fractions and multiples thereof. In polygraph, we have been traditionally measuring time, not in seconds but in inches or millimeters. When we say "10 seconds per inch," the portion of the measurement that has been typically included in the measurement equation has not been the "seconds" part but the "inch" part. A proper treatment of this, wherein we would calculate RLL using the “seconds” part would be algebraically complicated, because the X (horizontal) and Y (vertical) axis would then be measured on two different metric scales: millimeters or inches for Y-axis, and seconds for X-axis. The actual linear distance between to successive measurement points will be the angular hypotenuse, calculated between the horizontal distance between the points (in seconds), and the vertical distance between the points (in inches or millimeters). Start with the basic: A^2 + B^2 = C^2 Imagine a respiration cycle of 10mm in height over a period of 5 seconds, plotted at 10 seconds per 20mm. The inspiration cycle takes 2 seconds and the expiration takes 3 seconds. The I/E ratio is 2/3. Mathematically, we have RLL = sqrt(C^2) where (10mm * 10mm) + (5sec * 5sec) = C^2 or 100mm + 25sec = C^2 = RLL or 125mm per sec = C^2 = RLL or sqrt(C^2) = 11.181mm per sec = RLL You see, when we express something with a mathematical measurement, say 50, we have to say 50 what (what are the units of measurement). We have complicated this by using X and Y values that have different metrics (inches and seconds). In science, we don't get to discard the units of measure, unless we can cancel them out algebraically, and achieve a dimensionless value with no units of measure. It is desirebable to cancel out the units of measure, but it has to be planned for, and done properly. If we don't do this properly we are vulnerable to legitimate accusations that we are engaging in fictitious pseudo-science that is inconsistent with how measurement, math, inferential statistics, and scientific testing actually work. The present solution – measuring time in terms of inches or millimeters of paper or computer screen – is a shortcut that is not mathematically honest. The difference between RLL and excursion, is that excursion is a superior measurement because it is what we call “resistant.” Meaning that excursion is resistant to arbitrary changes in external conditions. For example... Using the same hypothetical specs, with a single respiratory cycle of 10 mm vertical height (Y-axis), over a duration of 5 seconds, plotted at 10 seconds per 20mm, we have: RLL = sqrt(C^2) where (10mm * 10mm) + (10mm * 10mm) = C^2 or 100mm + 100mm = C^2 = RLL or 200mm= C^2 = RLL or sqrt(C^2) = 14.142mm = RLL You can see that the unit of measure (mm) in this second example are simpler to understand than those in the first example (mm per second). So, you ask, what does this have to do with Al Franken, the field polygraph examiner? This all becomes important because when we say things like “change in IE ratio,” assuming we are speaking the language of science, we have to specify how much of a change matters, and what degree of minimal change does not matter? To answer these qeustions, we use words like “significant.” Again, assuming we are speaking the common language of science – assuming we want polygraph testing to be regarded as a valid form of science – we have to be willing to state our level of significance. “Significant” in science, means “statistically significant” and it is an expectation among scientists that we declare our level of significance – otherwise we allow willy-nilly decision in which something of a given value is significant one day, in one circumstance, while the same result is not significant on another day or under other circumstances. In practical reality it is acceptable to specify different requirements for significance under different circumstances, and the way to impose order on this chaos is to require a declaration of the required level of significance in advance of an experiment or test. 
In the above image, imagine two respiration cycles of 10mm in amplitude, plotted at 10 seconds per 20mm of chart paper or computer screen. The RLL measurement is obtained by calculating the Hypotenuse of the right triangle created by each pair of measurement points – for each pair of samples at 30 samples per second (= 300 samples for this 10 second segment). This example is unrealistic in that it assumes perfectly linear rates of inspiration and expiration throughout throughout the entire respiratory cycle. Actual inspiration and expiration rates may slow near the maximum tidal volume and minimum residual volume points, causing a more curved plot. For this example: RLL = 44.792 at the same time: Excursion = 40 Excursion is like measuring the amplitude without the X-scale, and involves no Pythagorean calculation. It is therefore simpler than RLL, and more robust against arbitrary changes in the rate of the X-scale plot. Why, you ask, is this important? The IE ratio in this example is 2/3, or .667 when using seconds as the unit of X-scale measure, and when using mm as the unit of X-scale measure. This ratio will be resistant to any change in the paper speed. Double or half the paper speed and the ratio will be the same. However, if we want to measure some more complex feature like line length, the measurement will be non-resistant to changes in the X-scale or plotting rate. For example: Double the screen scrolling rate to 40mm per 10 seconds and you get: RLL = 56.608 Half the X-scale rate to 10mm per 10 seconds and the result is: RLL = 41.258 Thee X-scale has NOTHING to do with physiology – the actual volume of physiological activity (change) is the same for each of these conditions. Only the X-scale is changing. Excursion is resistant to these changes. Excursion = 40 Regardless of whether the data are plotted at 20mm per 10 seconds, 40mm per 10 seconds, or 10mm per 10 seconds. All of this was a lot more unimportant on an analog instrument in which the kymograph operated at a fixed rate of 10 seconds per inch. In a computer based polygraph context, the rate of screen plotting or scrolling rate should not be allowed to introduce noise into our measurements. Now consider a scientific approach to polygraph scoring in which the measurements are reduced to a dimmensionless value such as a z-score (like the Stoelting CPS algorithm) or a ratio (all OSS versions). 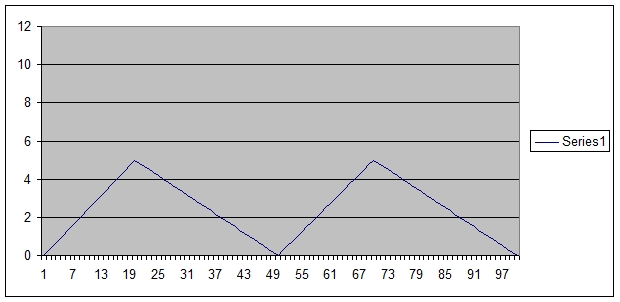
In the above image you can see the vertical (Y-axis) amplitude is suppressed to 5mm, while the IE ratio is the same as the previous image. RLL for the second series (plotted at 20mm per 10 seconds) is: RLL = 28.304 compared to 44.792 for the first segment, If we calculate the Ratio of RLL for the first and second segments, assuming the first measurement is the CQ and the second is the RQ we have: R/C = 1.583 Now, if we double the the X-scale metric, we have: R/C = 1.271 Now imagine what happens if we just as arbitrarily shoot the chart paper out at 1 meter per 10 seconds, and retain the hypothetical amplitudes of 10mm and 5mm. The ratio will be very close to 1. Meaning that RLL is non-resistant to changes in the X-scale metric. Then consider the Excursion measurements of 40mm and 20mm the Ratio will be 2 regardless of whether the screen data are plotted at 40, 20, or 10 mm per 10 seconds. The actual number itself doesn't matter, because these numbers do not attempt to refer to any particular physiological index – they are dimensionless representations of the volume of change in activity. What is important to us is that the numbers are indicative of a resistant metric. All the data will eventually be standardized and compared to norms anyway. For those of us who want to see a polygraph test with increasing scientific acceptance, we have to plan for standardizable procedures, standardizable metrics, and standardized normative reference data. Considering all the effort it takes to construct normative data, I suggest we will be better off devoting our efforts towards norming resistant measurement,s and avoiding wasteful effort to norm non-resistant measurements. This ends our math lesson for the day. There will be a pop quiz tomorrow. .02 r 
IP: Logged |
blalock
Member
|
posted 04-14-2009 12:14 PM
that was a great explanation, Ray! Thanks for the discussion.------------------
Ben blalockben@hotmail.com IP: Logged |
ebvan
Member
|
posted 04-14-2009 01:36 PM
Lets see if I get this,I will print out a copy of a polygraph chart. I will make a mark at stimulus onset on both an RQ and an ajacent CQ on the same chart and measure out 4 horizontal chart divisions from each mark (distance doesn't matter as long as it the same distance on both questions and the horizontal chart movement was constant) and then cut a couple of pieces of string from my kite and on each question carefully follow the graphical path of inspiration and expiration of the upper pneumo tracing on the chart until it reaches the 4th division mark. I then snip the string at the 4th horizontal chart division on both pieces of string straighten them out and lay them on a ruler. Wouldn't what I am measuring constitute 2 raw RLLs? In order to compare the two lengths of string I can choose to express them as a ratio. Geometry and Algebraic calculations aside What is it that an RLL algorythm does that is anything more that combining and comparing repetitions of this process assuming that the data is clear of artifacts? As long as the horizontal distance from the X axis is constant and the chart speed is constant,across the data being compared does it really matter whether it is expressed in millimeters per second or in furlongs per fortnight? ------------------
Ex scientia veritas IP: Logged |
rnelson
Member
|
posted 04-14-2009 03:43 PM
Ebvan,I apologize for the excess detail and chloroform. RLL does essentially what you describe. Excursion is slightly different. That difference is important to us because it does make a difference how we measure the x-axis. It should not - if we did things in a way that is mathematically correct. But we don't presently do things in a way that is mathematically correct - so it does make a difference. Look at this: Measurement for C3 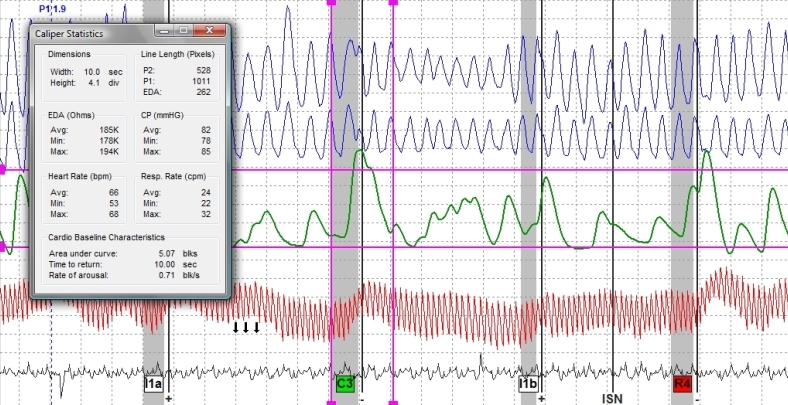
Measurement for R4 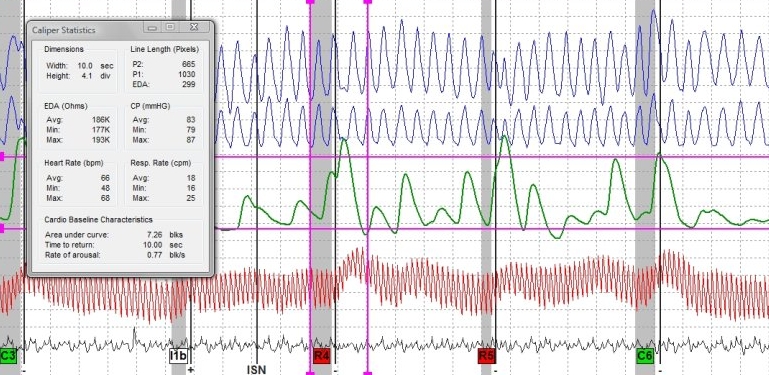
10 seconds of pneumo data for P2 (upper pneumo in the Lafayette system) give a measurement of 528 screen pixels at C3. 10 seconds of P2 at R4 gives 665. Of course, R/C = 665/528 = 1.259 Now, expand the screen display, and get this: Measurement for C3 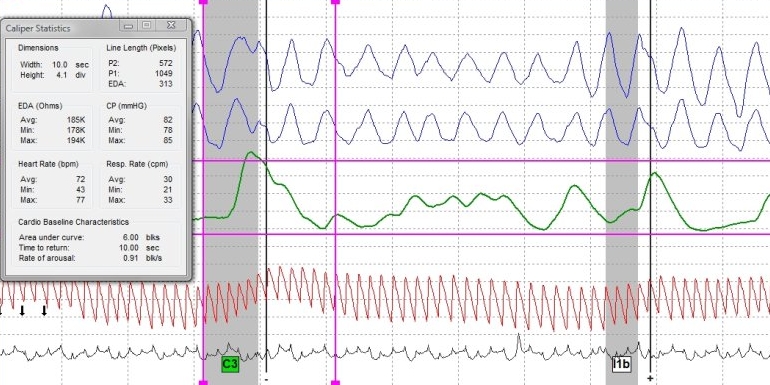
Measurement for R4
For which P2 for C3 = 572 while P2 for R4 = 713, the ratio for which = 1.247 Same bat-channel. Same bat-time. Different RLL measurements, and different ratio. It helps us to understand this, because we can then ask our instrument manufacturers to give us something better. They will most likely develop what we ask for. If they pay the 'lectric by giving us what we ask for, and we insist on a crap sandwich, then guess what - we're gonna get a crap sandwich. RLL is a non-resistant measurement. Excursion is Kircher's solution to the problem. Excursion is actually a lot simpler than RLL – no pythagorean calculation, and no arts-and-crafts sessions with the string and scissors. Just get the onset and offset values, then locate the high and low points in between and sum up all the absolute differences. If we think that the present state of polygraph science is entirely adequate, that there is no need to try to pursue greater levels of accuracy or increased scientific integrity, if we think polygraph is present good enough that scientific minded critics will eventually acknowledge the legitimacy of the polygraph when they have access to enough information about our present methods and technologies - then there is no need to care about the nitty-gritty details. There is also no need to improve anything and no need to change anything about the way we think, talk or go about our professional activities. If we think that the polygraph could be improved upon, that there is still incremental validity that can yet be accessed, and if we think that scientific minded critics are more likely to accept polygraph testing when they can be faced with evidence that the polygraph is just a test that is based on a sensible application of common and recognizable principles of psychology, physiology, measurement, and inferential statistics, then we will benefit from spending some time in the weeds with the nitty-gritty details. We'll learn something about what to do next, from an evidence based scientific framework, without having to take a wild-arsed guess about some individual's new and unproven fancy idea. Remember that most fancy ideas are just fancy ideas. The polygraph profession needs to consider itself evolved to the point where atheoretical fancy ideas supported by empirical inquiry alone are not satisfactory. Instead, empirical support would ideally be accompanied by a coherent theoretical model that can be reconciled easily with other fields of science, and with the basic principles of measurement and testing. If we think there is still any room or need to improve the polygraph test, then we may need to adapt some of the ways we talk, think and work. Best plan is to make those changes in a direction that is informed by good science and good math. .02
------------------
"Gentlemen, you can't fight in here. This is the war room."
--(Stanley Kubrick/Peter Sellers - Dr. Strangelove, 1964)
IP: Logged |
ebvan
Member
|
posted 04-15-2009 05:14 AM
#!%&$@# Raymond
I made the mistake of reading your last post just before bedtime last night and woke up at 3 am thinking about it. After tossing and turning for an hour or so, I decided to write this response so maybe I can get another hour of sleep.When we “expand the display” something interesting happens. Visually the distance between stimulus onset and the cutoff point increases and the tracing appears and measures longer because it crosses a greater number of pixels in its expanded condition.We aen't really measuring the "tracing line" we are counting the number of grid squares(pixels)it crosses. As you pointed out, this changes the ratios in our comparison. This occurs because when we do this on the recorded data in the computer everything changes except for the pixel size which remains constant. However if we print a screen captured image at twice its size the ratios remain the same because everything including “pixel size” is distorted by the same factor. If out chart was printed on a sheet of latex, when we stretched it out, everything including the sheet would distort and all things being equal, the ratios would not change.
There must be some way to mathematically calculate this “pixel distortion” For instance, if we doubled the distance between stimulus onset and the cutoff point we should be able to preserve the ratio by calculating our measurements based on a doubled pixel size. Since we can’t physically change the pixel size within the confines of our measurement; we factor in the distortion. I’m no mathematician, but it seems to me that by factoring this distortion into our calculation we would eliminate its effect on RLL ratio. Google Earth preserves its ability to measure distance at whatever zoom factor one selects. Why can’t we? Nighty Night
------------------
Ex scientia veritas IP: Logged |
rnelson
Member
|
posted 04-15-2009 10:36 AM
sorry EBV, you've been bit by polygraph minutiae.It is most certainly possible to correct RLL measurements for the zoom level on the screen. Think about this: 1) polygraph charts are really mathematical plots, 2) plots have both a Y-axis and and X-axis 3) in polygraph, the Y-axis represent change in physiology, and X-axis represents time 4) computers make it easy to zoom in and out, increasing and decreasing the size of the plot display. we normally zoom both the Z and Y axes. and finally, 5) When we zoom in or out of polygraph data, we zoom only the X-axis, not the Y-axis - this way the tracing amplitude is unchanged when we expand or contract the time display. The correct solution is probably Kircher's solution - excursion. The X-axis has nothing to do with physiology, and it is therefore incorrect to all X-axis metrics to influence the measured data. It's actually a lot easier than a convoluted mathematical correction necessitated by our desire to zoom X without Y - which still wouldn't fix the issue of the flawed algebra resulting from our stubborn and unscientific measurement of time in terms of pixels/inches/mm/henways instead of seconds. Kircher's solution is simple and achieves all of the objectives: good algebra, zoom X without Y, and removes noise from the physiological measurement. And it gives ratios that are resistant to arbitrary changes in external conditions.
r
------------------
"Gentlemen, you can't fight in here. This is the war room."
--(Stanley Kubrick/Peter Sellers - Dr. Strangelove, 1964)
IP: Logged | |


 Polygraph Place Bulletin Board


